
DIAGRAMME ANTHROPOLOGIQUE
2016
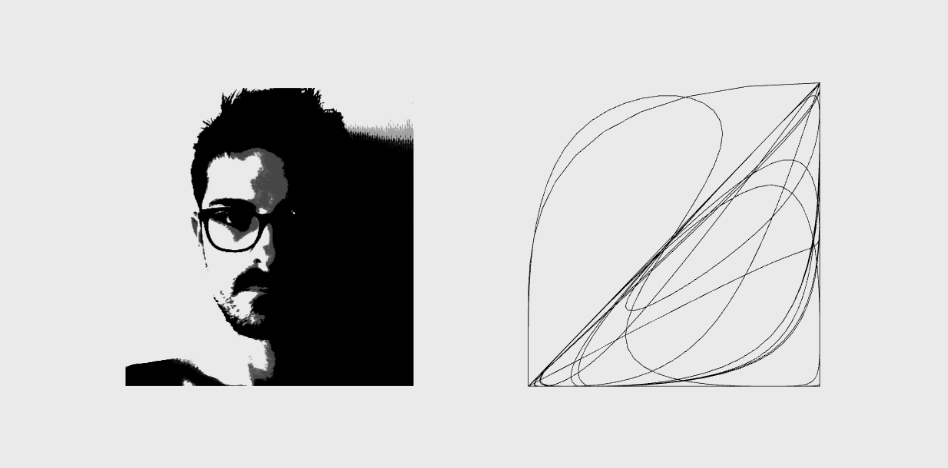
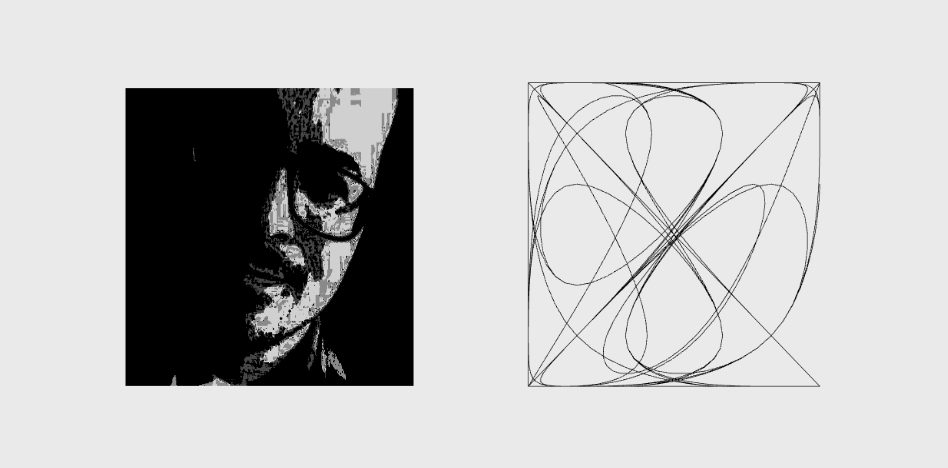
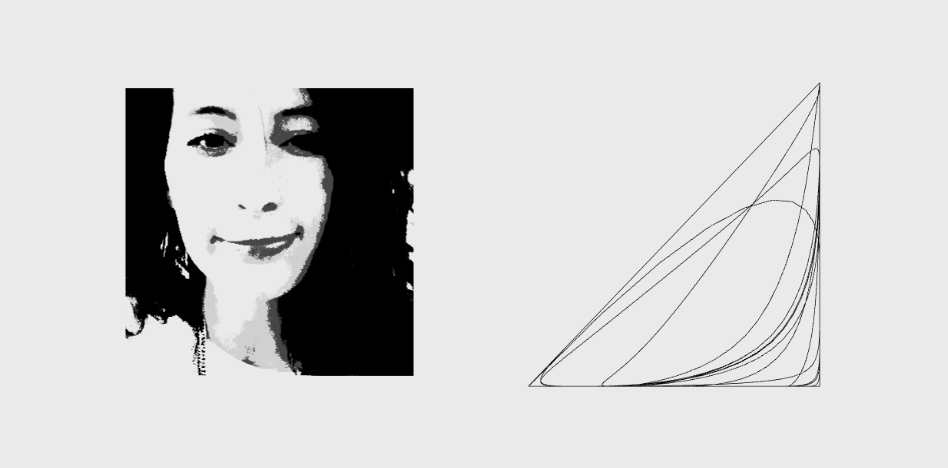
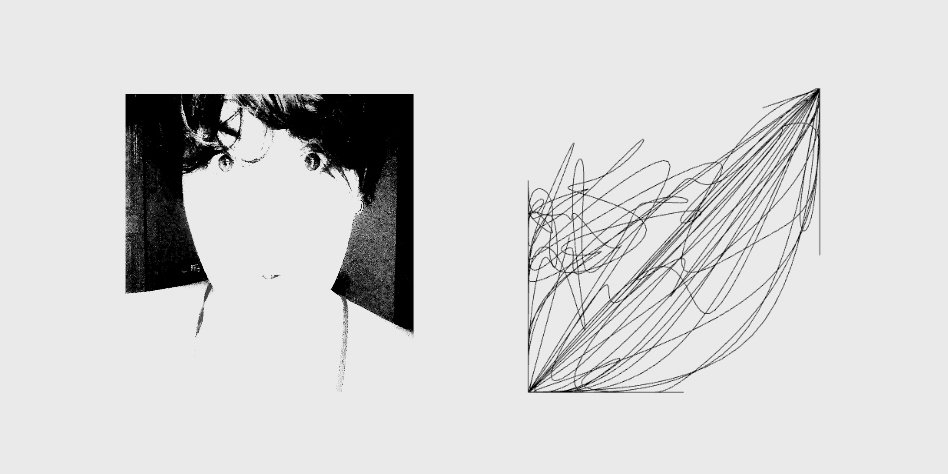
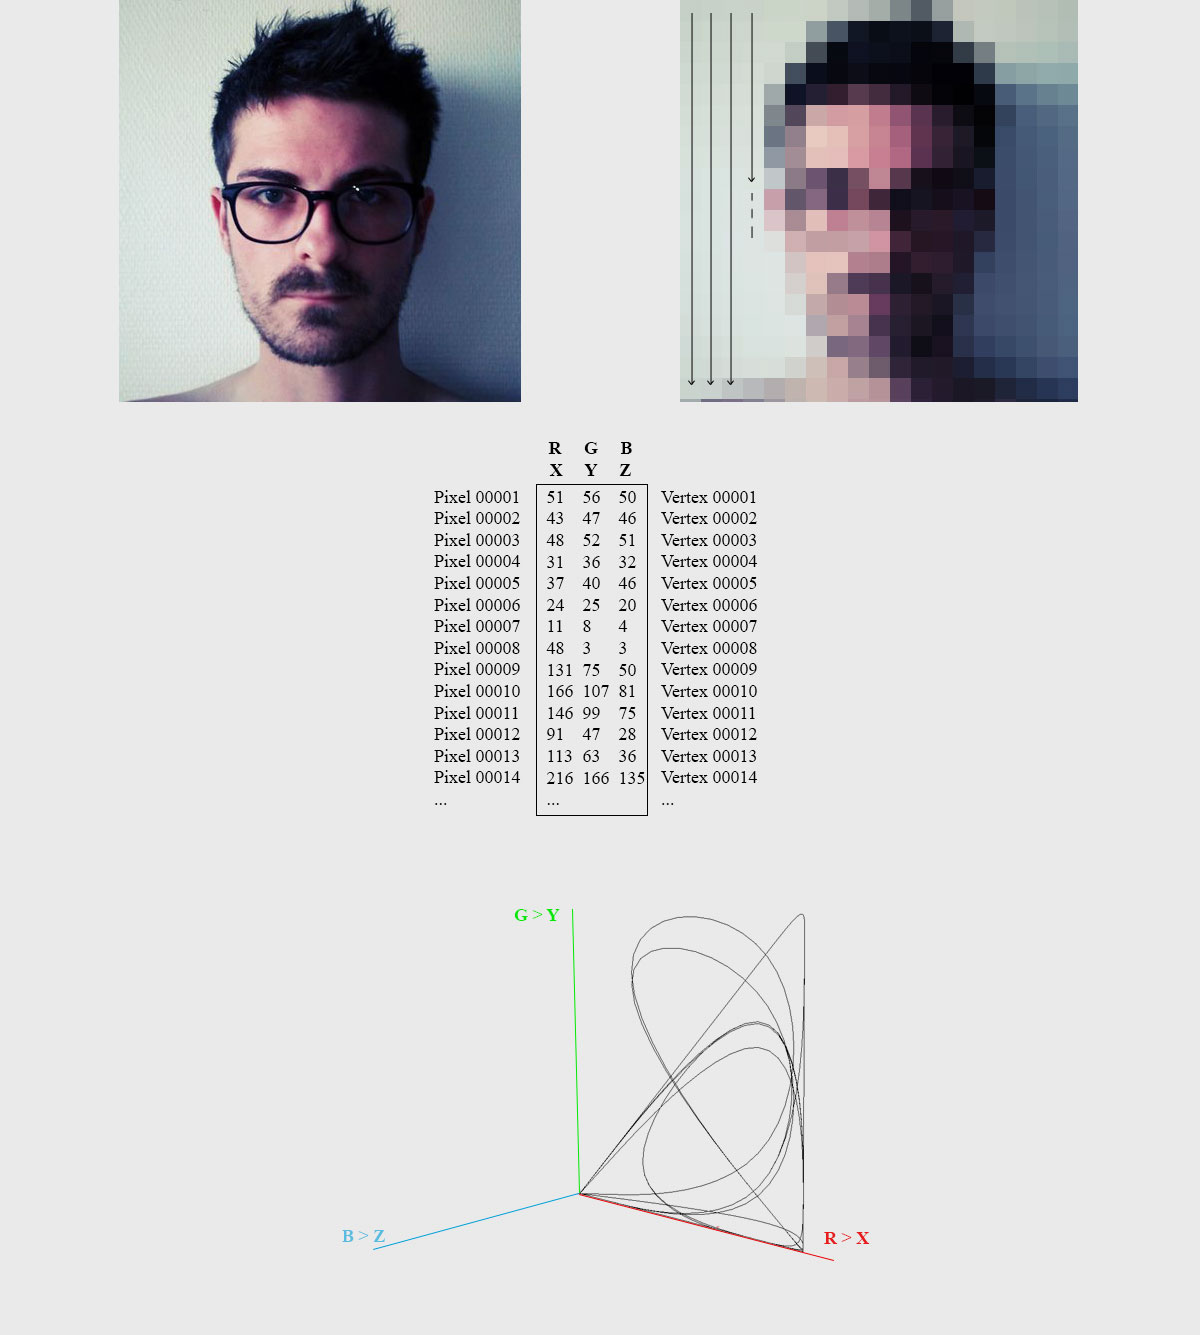
Un algorithme analyse une image de haut en bas et de gauche à droite. A chaque pixel, il ajoute ses valeurs RVB dans un tableau. Une fois achevé il transforme ses valeurs colorimétriques en coordonnées XYZ, puis génère une courbe avec autant de vertex qu’il y a de pixels. Afin d’offrir un certains dynamisme au résultat final l'ajout d'une variation temporelle est associé à la saturation de l’image qui fait évoluer le diagramme dans l'espace 3D. Nous faisons ainsi face à une cartographie tridimensionnelle d’un visage.
An algorithm analyzes an image from top to bottom and from left to right. At each pixel, he adds his RGB values to a table. Once completed, it transforms its color values into XYZ coordinates, then generates a curve with as many vertices as there are pixels. In order to offer a certain dynamism to the final result, the addition of a temporal variation is associated with the saturation of the image which makes the diagram evolve in the 3D space. We thus face a three-dimensional mapping of a face.
ANNEXES

CREDITS
Diagramme Anthropologique
script nodal
Réalisation : Gaël LABOUSSE
Matériels: PC
Logiciels: TouchDesigner